UbiStroke
The main problem with the current stroke evaluation method is that it tends to be based solely on the doctor’s clinical exam and judgement. While the doctors have done extensive training and studying, they are still subject to human errors. This results in them sometimes missing certain behaviors from the patient that aren’t clearly visible to the human eye, as well as disagreement between neurologists on their NIHSS scoring, the nationally used stroke scale.
Further, because a trained professional is required to perform the exam and resources are limited, stroke patients may not always get diagnosed in time to meet the narrow treatment window of 3 hours.
How can doctors get a better understanding of their stroke patients in a way that’s understandable and usable in the clinical setting?
Our Team
When I joined the project, the machine learning and engineering aspect was already well on its way, with the initial proof of concept for the most part completed and further work starting to be carried out. But they still needed to figure out how to take all of this new data and present it to the neurologists in a way that was understandable and usable in the clinical setting. That was where I came in.
My job was to work with our computer science graduate student lead to think about the design of this tool, both the patient side and the physician side.
Therefore, we needed to think about the design of two sides of the tool: the patient side and the physician side. We were already aware of a project from Microsoft called Assess MS, a system to help with the assessment of Multiple Sclerosis, that did some similar work for the patient interface side. But as far as we knew, there wasn’t something similar to what we wanted to accomplish for the physician side of things so we decided to start designing from there.
Initial Research
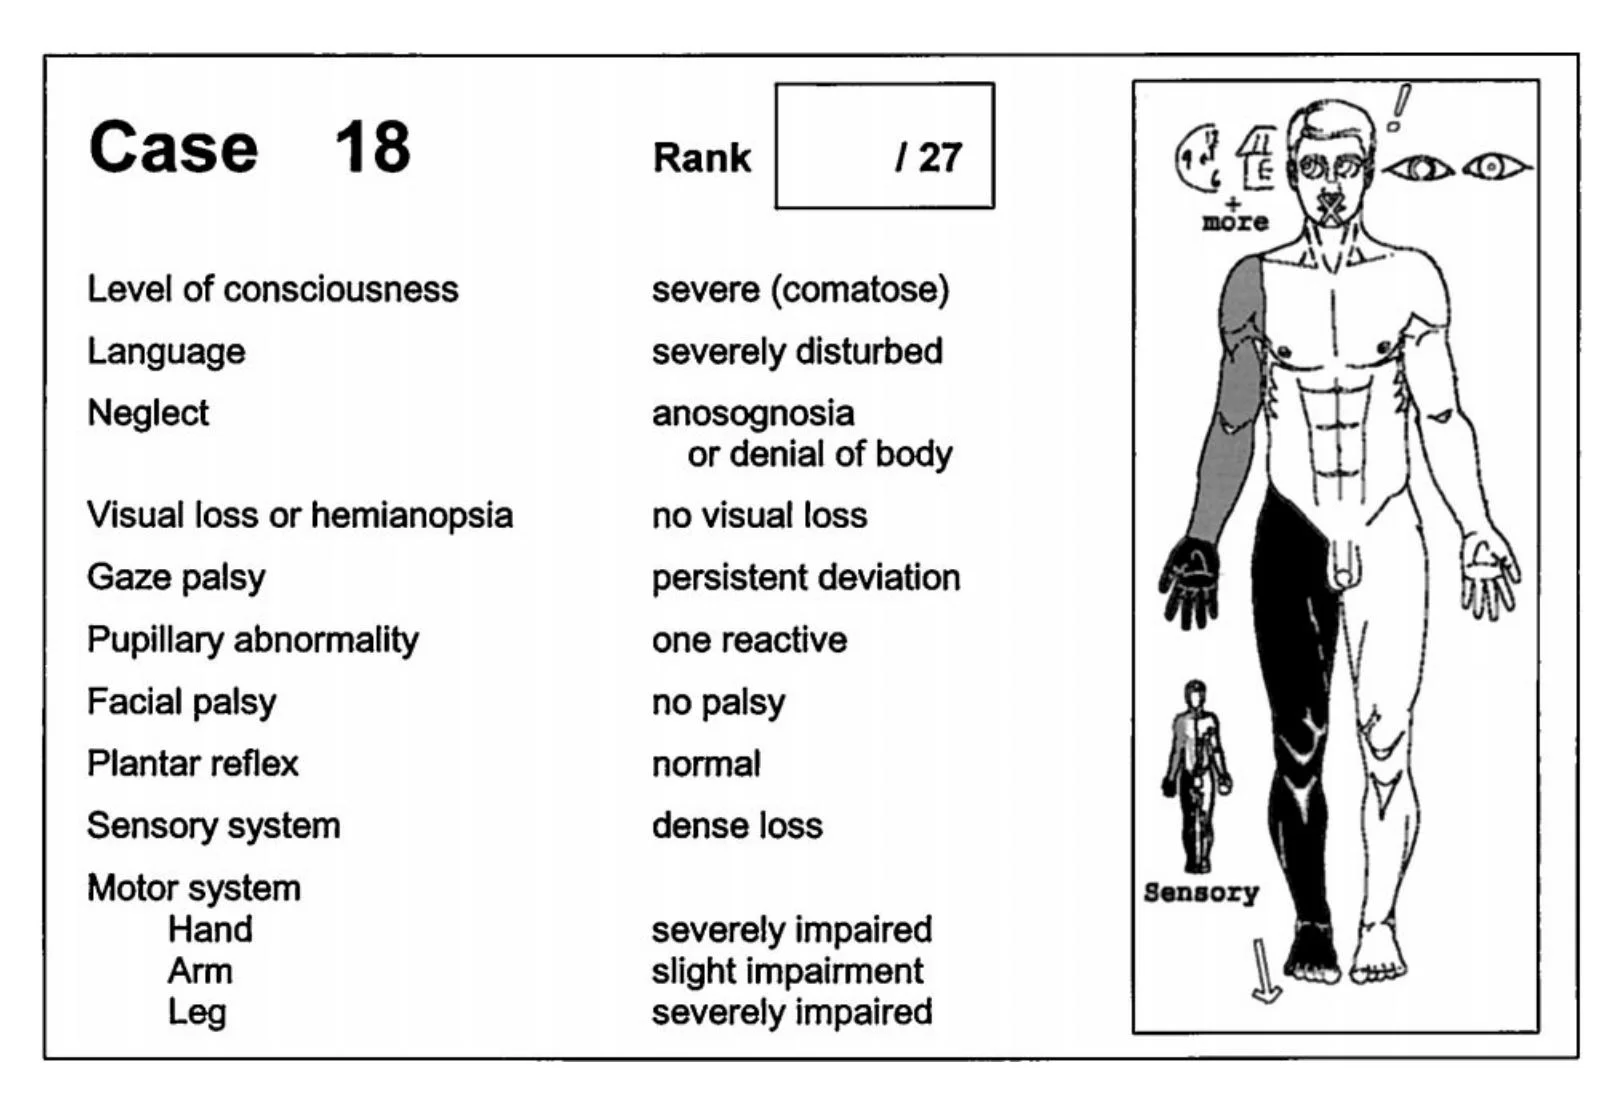
Gotoh, F., Terayama, Y., Amano, T., & Stroke Scale Committee of the Japan Stroke Society. (2001). Development of a novel, weighted, quantifiable stroke scale: Japan stroke scale. Stroke, 32(8), 1800-1807.
The first step was to run a literature review in the realm of data visualization and representation for complex multimodal systems, to see if there might be anything that would give me some insight and perhaps inspiration. I started with stroke research, but then expanded into other neurological disorders, and even vehicle diagnostics. The selection was limited but I was able to see a few common patterns emerge. Most studies represented their results with line tracings, regardless of the body part or behavior. I also consistently saw the results of healthy patients being used as a baseline comparison of what is expected. And I found that visualization didn’t always explicitly mean a graphical representation, as numerical representations were often used in conjunction with the graphs as well.
I found one study particularly interesting because they made use of mapping symptoms on a diagram of a human body to summarize a patient’s condition. This opened my mind to different possibilities for visualization for the physician side.
I collected these results to start a tentative list of design considerations:
Tool should provide comparison to healthy patient or expected results, to visualize differences in patients with stroke
Tool should represent stroke symptoms with graphical and numerical representations
With this basic information in mind, our team decided that the next steps for this project should be to run a focus group with the neurologists since we were dealing with so little background information. As for the patient side of the design, I decided that it would be best to both use the Assess MS as a reference starting point and to go into the stroke clinics to see how patients do with the standard stroke exam. If there are any difficulties that they already face when trying to follow the instructions from the neurologist, then these would be important to consider carefully for our design.
With this basic plan in mind, our team met with our neurologist consults to present our preliminary ideas to get feedback. Fortunately they were enthusiastically interested in our thoughts for the physician side of the tool, but unfortunately, they were not invested in having a patient side interface. They were not in favor of a tool that would encourage evaluations of patients without the presence of a doctor, for two reasons. First, this would take out the role of the neurologists. Even though they would be evaluating the results later, by not being able to examine the patient themselves, they would still feel like their jobs were at risk. Secondly, a clinical exam goes beyond just the resulting scores. Neurologists gain valuable information just by observing patients face to face, when they are walking into the exam room or other behaviors that aren’t necessarily taken into account by the stroke scale. By just sending results remotely, neurologists would lose a lot of valuable insight that would allow them to make an informed treatment decision.
This meeting put our assumptions in check and gave us new insight into the needs and wants of our users.
Focus Group
With these new insights in mind, I reoriented the design of our UbiStroke tool. Our tool would no longer be used to help the diagnoses of patients in the absence of a trained doctor but rather, it would now be a tool that would be used in conjunction with a neurologist. Neurologists would still carry out their exams as they usually would, but with the new information coming from our tool, we intend for them to have new insights into measurements that they may not have detected themselves.
We created our focus group schedule around this new approach to the tool. We focused on learning more about their process and approach, mentally and physically. What problems are they facing now? Have they had cases where a lack of information affected their diagnosis? What do they want to do with the data?
Our focus group was about asking open questions to stimulate discussion and limiting how much we discuss the possibilities for machine learning so we don’t influence their thought processes.
The focus group was incredibly insightful for me, but the most notable feedback was:
Specific symptoms co-occur so if the doctor notices one of the symptoms, they’ll try to look more closely for the other associated symptoms. A lack of co-occurance can be an indication of a faker, or someone who thinks they have a symptom but actually doesn’t.
They don’t want the tool to just give more detailed NIHSS judgements, they want data to deviate slightly to cover things that aren’t specifically addressed by the scale.
They would find it useful to receive some sort of definitive score or number, accompanied by graphed data to explain how the tool came to that decision.
Telemedicine, acute cases, and rehabilitation all have very different approaches to evaluating stroke.
Doctors were interested in the possibility of receiving probabilities of presence of stroke and stroke type, as well as the associated symptoms.
Comparisons to a control/normal subject, or other patients to see how far the deviation is.
There is general concern about people becoming over-dependent on a tool like this, especially if they are less experienced.
Some of the responses from neurologists matched with the patterns I had noticed during my literature review, which made me more confident in the brief list of design requirements I drafted.
Initial Designs and Sketches
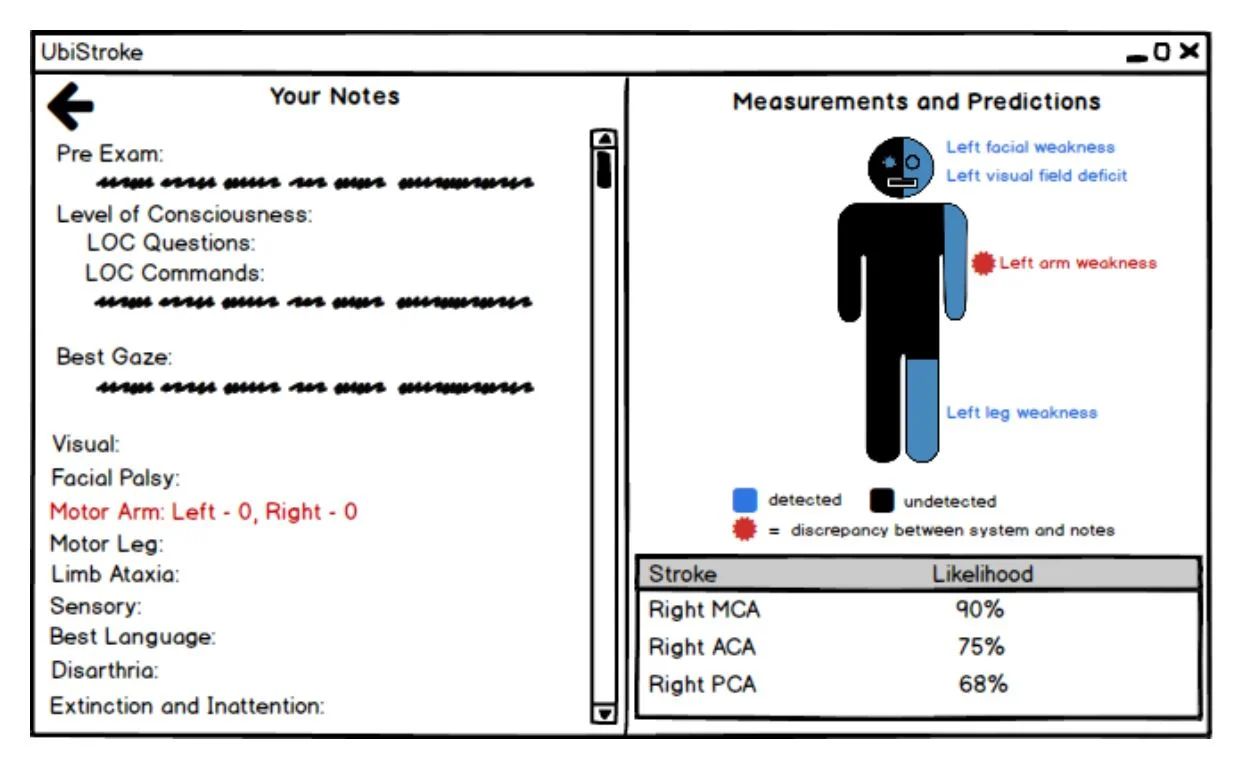
Idea 1: Graphical representations of a patient, with the system highlighting the notable deviations from the norm.
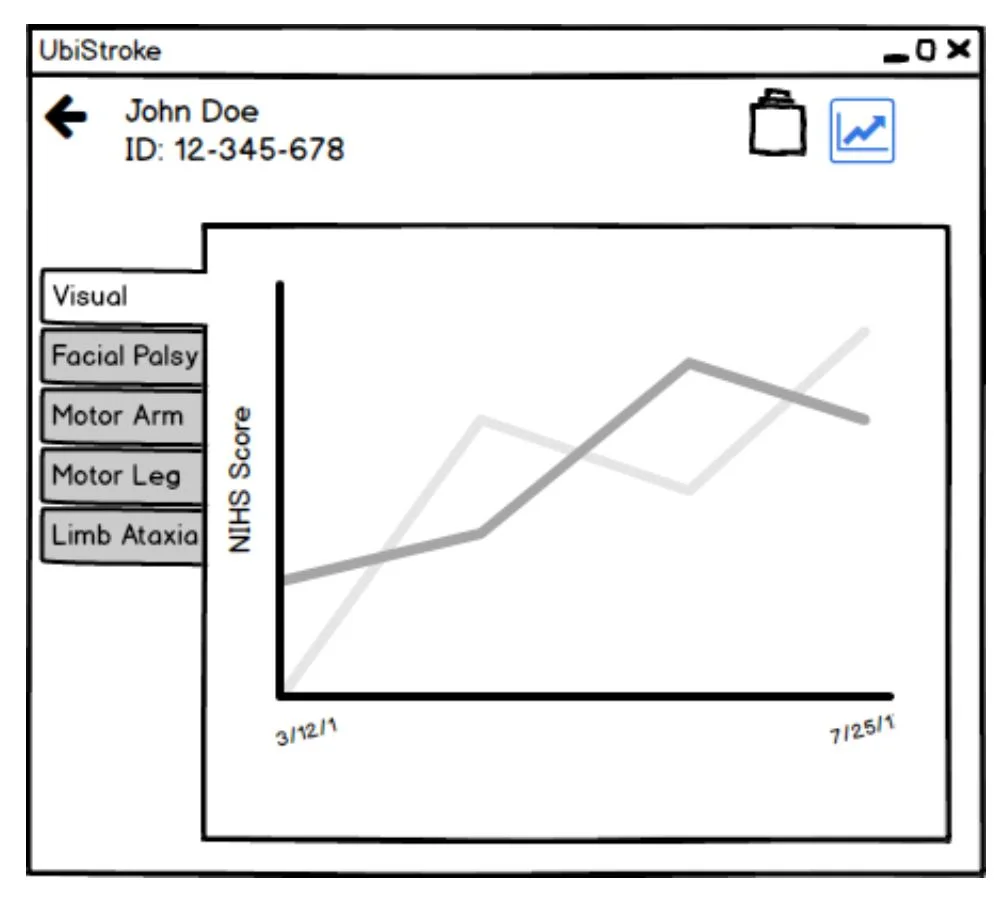
Idea 2: A catalog approach, where medical staff can go back and forth between different exam overtime and see any changes or improvement in symptoms.
Idea 3: Inspired by literature review studies, representing the patient’s stroke by displaying their symptom severity on their body.
Our team brainstormed ideas and came up with a variety of approaches. Above is just three examples.
Iterations
I then explored these ideas by using Balsamiq and making use of their click through feature to start experimenting with how the prototype flow would feel.
Next Steps
Progress on the design front has been halted for the time being as the neurology department is busy on-boarding new attendings and is unavailable to meet to give feedback. But this doesn’t mean that I can’t think about next steps for the project.
I plan to do a final review of the prototypes to see if any new ideas come up that we want to explore. I will then organize and consolidate the prototypes into a few distinct prototypes to allow the opportunity to do parallel prototype testing.
There is a concern over scheduling as the neurologists are generally busy which makes it difficult to set aside enough time to do proper individual runthroughs. Our team is considering alternative methods such as a survey containing interactive prototypes and testing through a video conference. Regardless of what we choose to do, I am adamant that we have at least a few in person meetings so that we don’t lose the information that can sprout up unexpectedly in an in person discussion.


